Saturday, March 27, 2004
The smoothest economic ride ever.
The Economist reports that the economy has been performing ever more smoothly over time, with ever fewer of those euphoric ups and nasty downs, and milder ones too.
Now this might seem a strange claim in light of the recent bubble-and-bust, so I got the official numbers for the US from the horse's mouth myself, and by golly it's true!

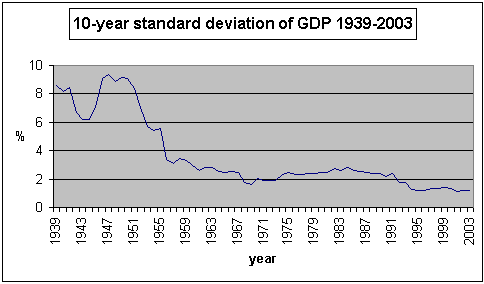
This chart shows the standard deviation in the annual growth rate of US GDP for 10-year periods ending in 1939 through 2003. That is, in the number of percentage points by which annual inflation-adjusted GDP growth changed (up or down) from year-to-year over the ten years.
That's quite a drop! From nine percentage points during 1930-39 -- and more than five points as late as the mid-1950s -- to only about one point today. And it has been very much the same story in the other developed economies of the world.
The US economy's recent bubble-and-bust, from which we have not yet fully recovered, has of course been a big story in our minds -- but by historical standards it has been mild (the stock market's performance notwithstanding) and it followed the longest period of uninterrupted economic expansion on record.
This decrease in volatility of GDP is good. It means that investors face less risk. So, other things equal, interest rates fall and the value of stocks rises (e.g., p/e ratios become higher).
Why the change to steadier economic performance? Three factors in time order: the end of the gold standard in the 1930s; the growth in the size of government -- whatever other good and bad consequences this has had, it has increased the impact of government as an economic stabilizer; and the climb of the world's leading central banks up the learning curve, especially over the last 30 years, as they have become much more adroit at implementing monetary policy. For more on all this check The Economist's story.
The Economist reports that the economy has been performing ever more smoothly over time, with ever fewer of those euphoric ups and nasty downs, and milder ones too.
Now this might seem a strange claim in light of the recent bubble-and-bust, so I got the official numbers for the US from the horse's mouth myself, and by golly it's true!

This chart shows the standard deviation in the annual growth rate of US GDP for 10-year periods ending in 1939 through 2003. That is, in the number of percentage points by which annual inflation-adjusted GDP growth changed (up or down) from year-to-year over the ten years.
That's quite a drop! From nine percentage points during 1930-39 -- and more than five points as late as the mid-1950s -- to only about one point today. And it has been very much the same story in the other developed economies of the world.
The US economy's recent bubble-and-bust, from which we have not yet fully recovered, has of course been a big story in our minds -- but by historical standards it has been mild (the stock market's performance notwithstanding) and it followed the longest period of uninterrupted economic expansion on record.
This decrease in volatility of GDP is good. It means that investors face less risk. So, other things equal, interest rates fall and the value of stocks rises (e.g., p/e ratios become higher).
Why the change to steadier economic performance? Three factors in time order: the end of the gold standard in the 1930s; the growth in the size of government -- whatever other good and bad consequences this has had, it has increased the impact of government as an economic stabilizer; and the climb of the world's leading central banks up the learning curve, especially over the last 30 years, as they have become much more adroit at implementing monetary policy. For more on all this check The Economist's story.
